In a recent blog post, I discussed the ever-increasing importance of observability and the availability of actionable data in the management of SAP estates and other mission-critical systems.
As I wrote in October, there has been an explosion in the amount of data that is available, with automation and predictive technologies really coming into their own.
Apiphani considers services in these areas to be key to our value proposition, and we use our proprietary Deep Automation™ technology to greatly reduce human error, freeing our engineers to focus on more meaningful work.
In this post, we’ll take a bit of a deeper dive into how we do this.
The Elements of Observability
The Pillars
Observability begins with data. The data itself comes from our application performance monitoring systems, including log monitoring, our ITSM system, the cloud monitoring tools available, SAP native tools such as Solution Manager, and of course our own technology.
When information from these products is fed into a data lake and analyzed and visualized, it is possible to perform descriptive, predictive, and prescriptive analytics – the cornerstones of an effective business analytics strategy.
Our tool for making this data actionable is our Enterprise Delivery Management tool, Luumen.
AWS CloudWatch and Related Services
Amazon Web Services (AWS) CloudWatch has been an excellent visibility tool for all elements of AWS infrastructure since the inception of the platform. By tying these insights into other useful AWS Services – including Event Bridge, System Manager Ops, and System Notification Services (SNS) – you arrive at a tightly integrated early warning system.
In fact, by using these elements correctly to manage SAP estates on AWS, apiphani has been able to alert our clients to more generalized issues throughout their enterprise.
AWS continues to move up the stack with these services, introducing CloudWatch Application Insights for SAP HANA in 2021 and Insights for SAP Netweaver in 2022.
In addition to being integrated with third party high availability (HA) products (Pacemaker), Application Insights provides actionable information on availability and connectivity information at the application level, as well as log scraping and other performance metrics.
Apiphani combines these with insights from Dynatrace, an application performance management tool, in a belt and suspenders approach.
Dynatrace
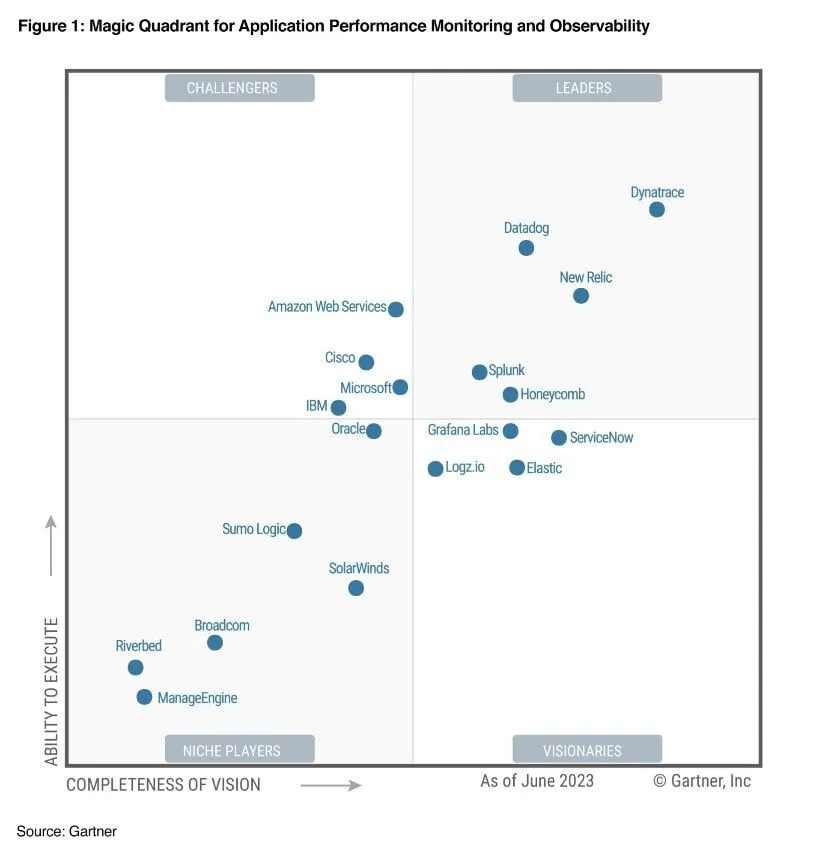
We leverage Dynatrace, a SaaS based software intelligence platform, for monitoring/alerting on SAP systems. A 13-year leader in the Gartner Magic Quadrant for Application Performance Monitoring and Observability, Dynatrace gives apiphani both the granularity and breadth of data we need to “own the stack.”
Dynatrace uses its product OneAgent to send all captured data to a Monitoring Environment. This environment resides in the cloud and is where all performance analysis takes place.
To capture infrastructure health information, we push Dynatrace One Agent to every monitored virtual machine. In this way, we have performance metrics, problems, events, and service and process data to aid in our analysis.
As part of the overall solution, we also leverage the Dynatrace custom extensions for SAP ABAP, SAP HANA, Oracle, and MSSQL Databases. These extensions allow for the collection of performance and availability data of the relevant applications.
Dynatrace offers synthetic transaction monitoring and full stack monitoring (which gets to the code level for Java-based applications such as SAP Hybris).
Any anomalies are tied to apiphani’s ITSM (ServiceNOW) and alerting system (PagerDuty).
We use Luumen to curate and visualize key elements from Dynatrace and drill down to the Dynatrace SaaS backend as necessary for additional detail.
Figure 1- Selected Luumen Performance Metrics


SAP Solution Manager
SAP Solution Manager is SAP’s internal Application Lifecycle Management (ALM) platform. It’s required to install, patch/maintain, and upgrade SAP systems, so apiphani interacts with it extensively at a task execution level.
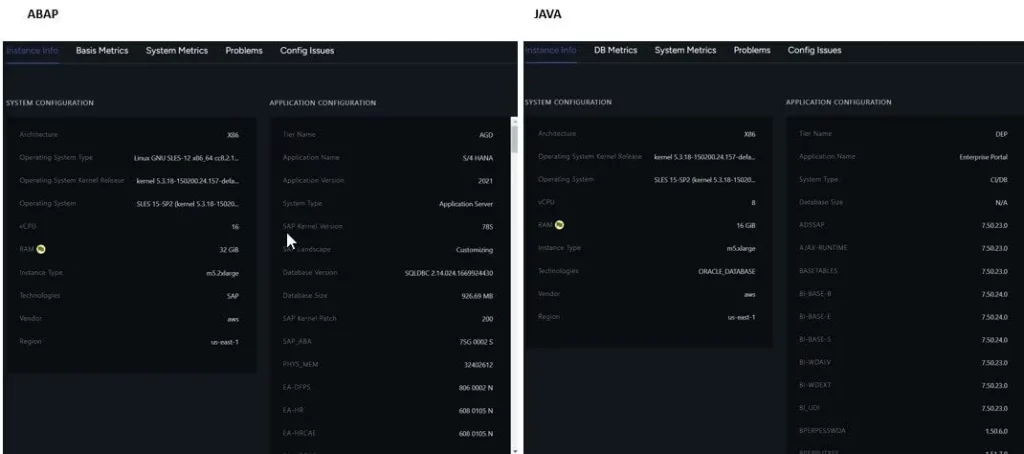
Among several other critical functions, it connects to the SAP Landscape Directory (SLD). Information on installed components and their patch level is stored in the SLD. When combined with other configuration information, we can quickly analyze the susceptibility of various systems to vulnerabilities and take the appropriate actions to protect them.
In addition to collecting this data, we also track it for changes, so we can tie any anomalous data to a recent change.
Figure 2- Luumen Curated and tagged system data from System Landscape Directory
The Integration Layer: Luumen
While all of these partner tools are critical pieces of the puzzle, it is apiphani’s Luumen tool that does the curating and allows for consistent delivery at scale.
Luumen supports our efforts in three ways:
- Consistency is ensured using automated processes. These mean that service delivery is done promptly and to spec. Every time.
- The systems are Always On. Our machine language (ML)-empowered technology resolves many issues before they become a crisis, while in the background all activities are logged to the ticketing system for future review or audit.
- Costs are managed. The cost of an SAP outage varies by company, but it is always too high. Our technology and people ensure that your mission critical systems are available and performing at peak and only utilizing the resources they need.
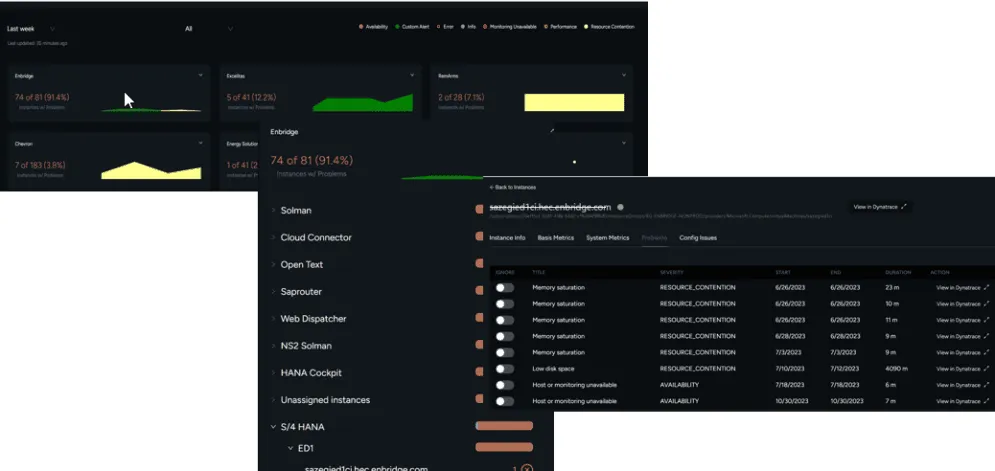
For example, our master dashboard allows for an at-a-glance view of the health of system groups by estate and application. You can go quickly from an overall view of health to a single virtual machine and see any anomalies, from the infrastructure to the application level.
Figure 3 – Master Dashboard and Drill Down
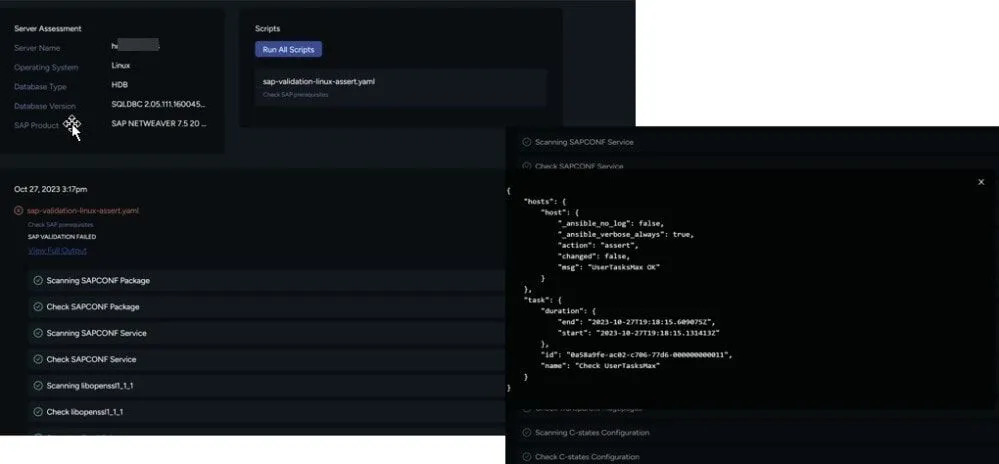
Our “acceptance to run” tool checks selected systems against the SAP marketplace required-and-recommended settings at the operating system, database, and SAP application level. Out of tolerance values can then be quickly identified and remediated.
Figure 4 – Acceptance to Run
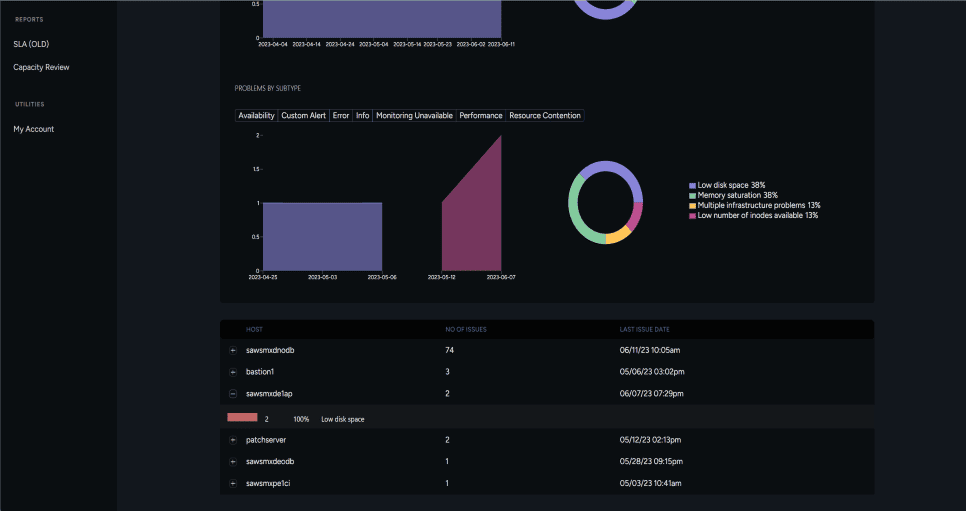
Our problem evaluation tool reviews and groups anomalies across estates, allowing us to see trends by error type and server. We can identify various resource contention issues, and group errors by type.
We can also identify “top talkers” by server, and then see the error types that are occurring on the servers with the greatest number of issues. In this way, problem machines and cross-estate problems can be quickly identified and remediated.
Figure 5 – Problem Evaluation
At apiphani, we believe observability and automation are key to delivering the best outcomes to our clients. Working with our clients in the spirit of co-innovation, we continue introducing new functions to our tools, and when we put these tools into the hands of our amazing delivery team, the results are something we look upon with pride.
Transform Your IT Management With Apiphani
If you’re striving for efficiency, reliability, and innovation in managing your mission-critical workloads, apiphani’s application managed services are your solution.
Embrace the future of IT management with our unique blend of observability, automation, and Deep Automation technology. Let us help you reduce human error and optimize system performance, allowing your team to focus on what truly matters.
Don’t just manage your IT environment—transform it.
Contact Us
- Tell us more about your business and what you need from automation and business software.
- 53 State Street
Suite 505
Boston MA, 02109 - Request a Quote: +1 (833) 695-0811
